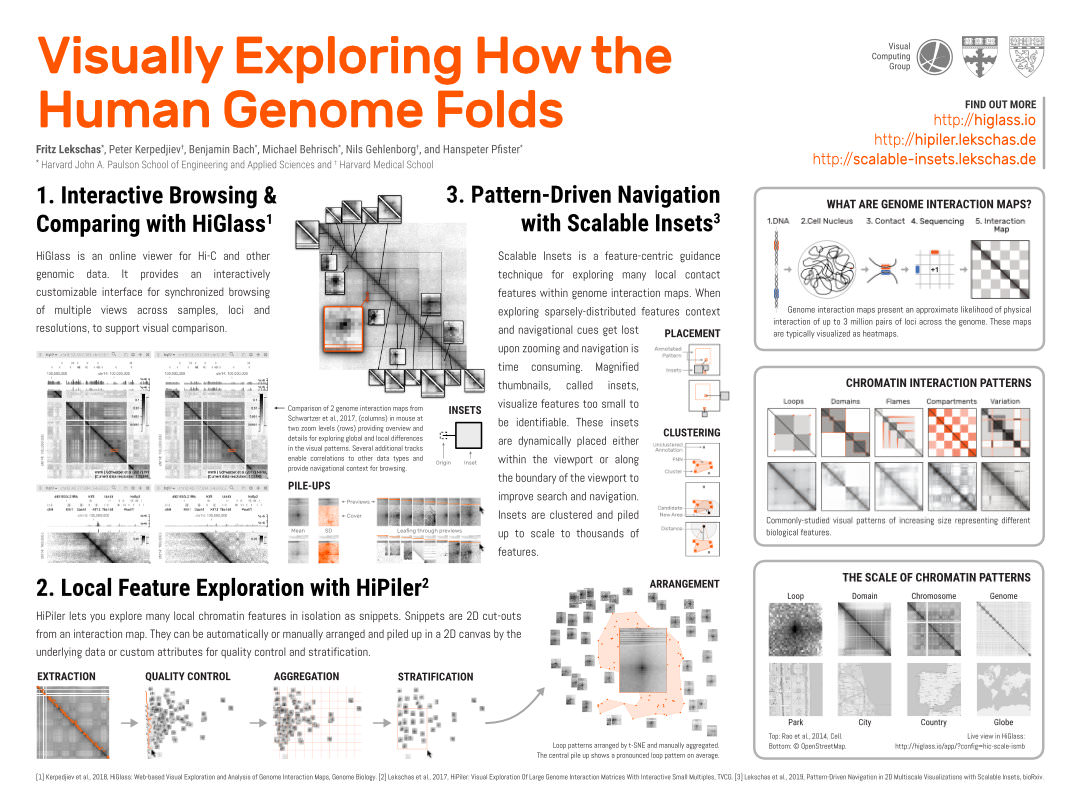
The human genome is about 2 meters long and tightly folded into the cell nucleus, a sphere that is 4 million times smaller than a pinhead. How do cells avoid entangling the DNA and ensure accessibility of necessary parts? Biologists study DNA folding through the detection of pairwise physical interactions along the DNA, which results in a 3-by-3 million pixel matrix. Visualized as a heatmap, thousands of local visual patterns become apparent. Studying these patterns is like trying to understand the average layout of parks while viewing countries on a world map. Biologists need to inspect matrix patterns and correlate them to other epigenomic profiles for sensemaking of biological features. We have developed several interactive tools to explore such large epigenomic datasets at different steps. HiGlass supports synchronized browsing and comparing of 1D and 2D data. HiPiler enables local 2D pattern exploration at scale through visual decomposition. To provide guidance during navigation and exploration in 2D maps we have developed Scalable Insets. Finally, Peax is build for interactive visual pattern search in 1D epigenomic data using unsupervised deep representation learning.
Visually Exploring the Genome At Scale
Visualization Systems for 1D and 2D Epigenomic Data
Introduction
Tools
-
HiGlass Fast Contact Map Visualization
-
HiPiler Pattern Exploration with Small Multiples
-
Scalable Insets Pattern-Driven Guidance in Contact Maps
-
Peax Interactive visual pattern search in 1D data
Publications
-
HiGlass: web-based visual exploration and analysis of genome interaction maps
Genome Biology, 2018, 19:125. doi: 10.1186/s13059-018-1486-1Featured in Nature News -
HiPiler: Visual Exploration Of Large Genome Interaction Matrices With Interactive Small Multiples
IEEE Transactions on Visualization and Computer Graphics (InfoVis '17), 24, 1, 522-531, 2018. doi: 10.1109/TVCG.2017.2745978Featured in Nature TechBlog -
Pattern-Driven Navigation in 2D Multiscale Visualizations with Scalable Insets
IEEE Transactions on Visualization and Computer Graphics (InfoVis '19), August 22, 2019. doi: 10.1109/TVCG.2019.2934555BioVis Best Poster Award -
Computer Graphics Forum (EuroVis '20), 39, 3, 2020. doi: 10.1111/cgf.13971EuroVis Best Paper Award